|
|
|
|
|
|
|
|
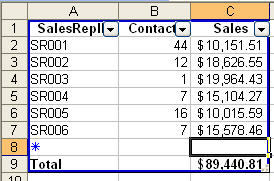
Data List: Add and Change Total Row CalculationsData lists, which marry the benefits of XML and filterable data tables, were one of the new features introduced in Excel 2003. The following graphic shows what a data list looks like.
Note that the data list, which is surrounded by a blue border, has a series of headers with filter arrows attached. You can filter the list's contents in exactly the same way as if you had applied an AutoFilter to a regular data table. Row 8 contains an entry row; if you've used Access forms, you'll recognize the asterisk in cell A8 as the marker indicating the fields designated for new data entry. The bottom row of the data list is the Total Row. If your list doesn't have a total row, you can add it by clicking any cell in the data list and choosing Data | List | Total Row. The Total Row contains a summary calculation, in the form of a SUBTOTAL formula, in the right-most cell. The default summary operation is Sum, but you can change that operation if you like. To change the summary function of any cell in a data list's Total Row, select the cell in the Total Row, click the down arrow that appears to the right of the cell, and click the summary operation you want to apply (you can choose from None, Average, Count, CountNums, Max, Min, Sum, Standard Deviation, and Variance). Excel will change that cell's SUBTOTAL formula to reflect the new operation. You should also note that column B doesn't have a summary operation at the bottom. If you'd like to add a summary operation to that column's cell in the Total Row, click the cell and choose the operation you'd like to use. |
